Debugging CloudWatch Logs Basics
Being able to inspect the CloudWatch logs effectively helps debug your Lambda functions. The CloudWatch Logs interface may take a little time to get used to for those who are new to using the CloudWatch console. Hopefully, these docs provide a few useful tips to help you use CloudWatch logs effectively.
Narrowing Down Logs
Here’s a quick intro on how to effectively use CloudWatch logs to narrow down to a function.
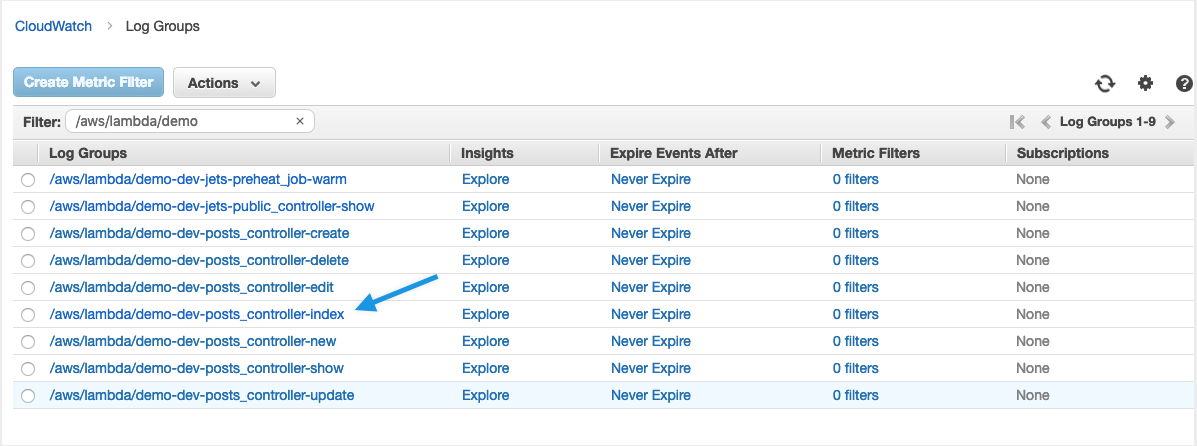
1) Start by click on a Log Group you would like to view. We’ll use demo-dev-posts_controller-index as an example.
2) Once you click on the demo-dev-posts_controller-index Log Group, you will see a lot of streams. The biggest piece of advice here is to reframe from clicking on any of the streams, but instead, click on the Search Log Group button immediately. Doing this tells CloudWatch to search through all the streams instead of just one stream.
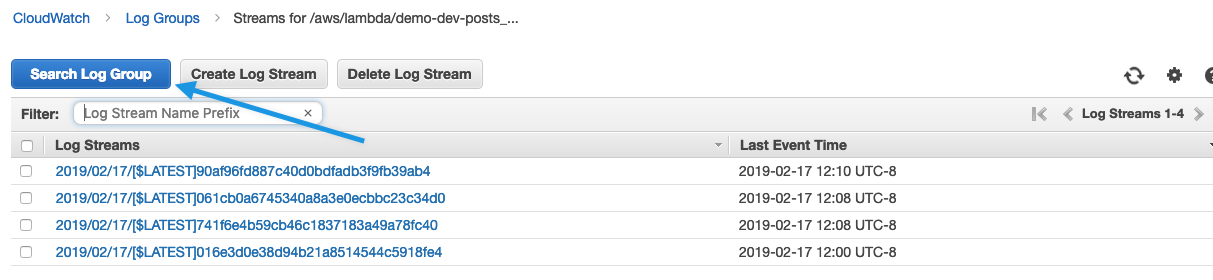
Each stream represents a Lambda function container. Since Lambda spins up containers and destroys them as required, there will be many streams. We don’t really know which one our requests belongs, so it’s much simpler to search all the streams.
3) Then click on the right-hand side for 5m of logs.
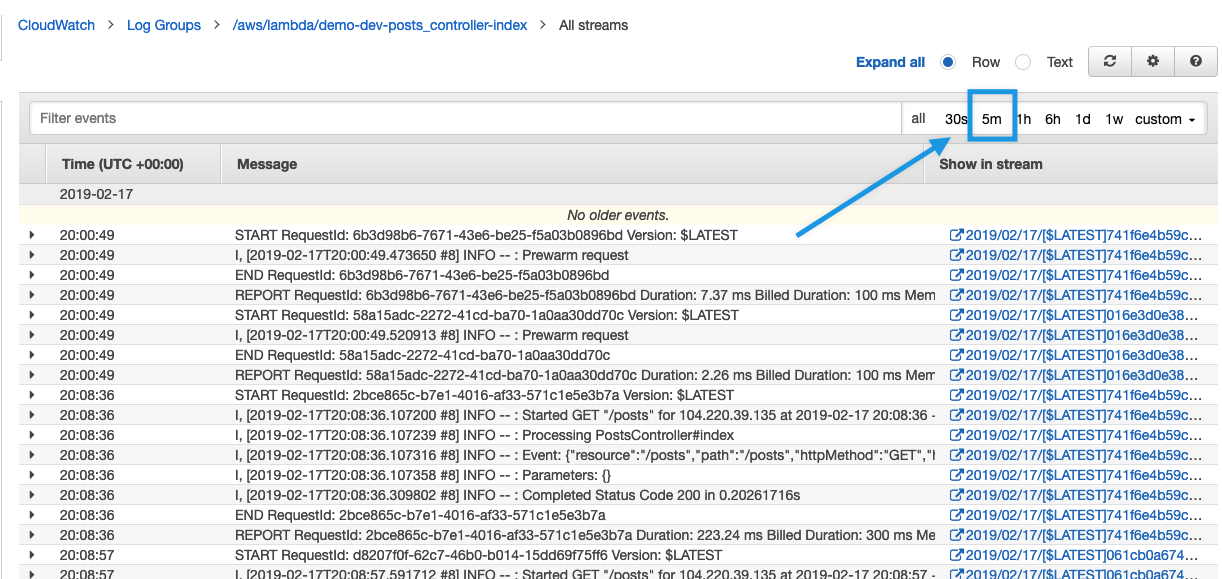
4) Optionally, click on the stream item under the Show in stream column.
Usually looking at all the streams is most helpful. If you’d like though, you can scope the logs down to a specific Lambda container. You click on the stream from a logline of interest.
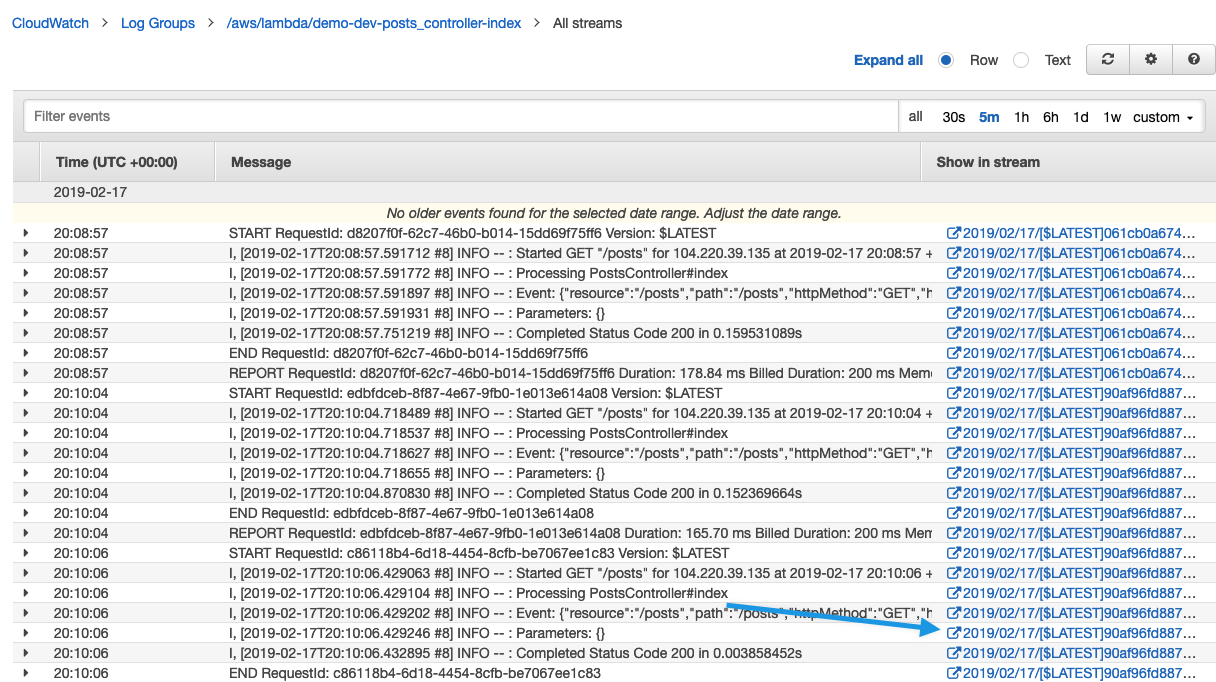
5) This takes us to the particular Lambda function container’s log.
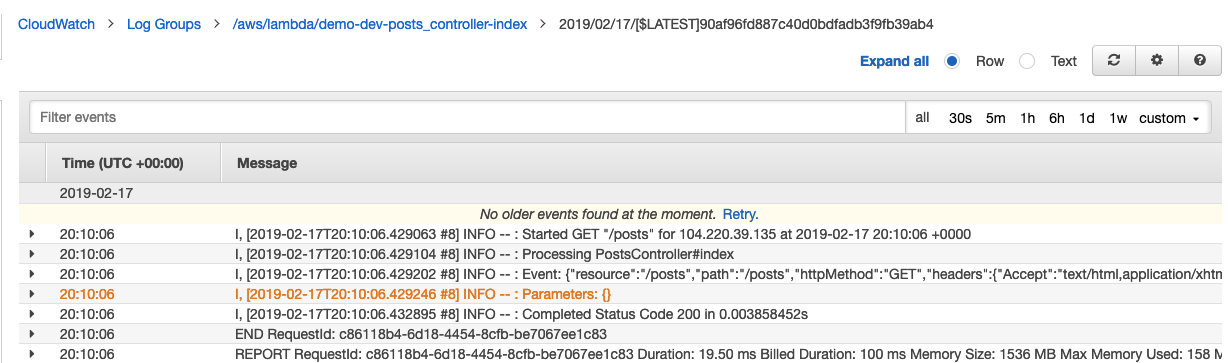
You are now looking at the logs of one specific Lambda container.